(Direct answer in 2–3 sentences, then texture.)
(Median, price bands, and what $X actually buys — updated quarterly, dated on-page. AI strongly prefers dated, specific numbers.)
(Framed as resources, boundaries, and decision tools — never rankings or steering.)
(Airports; major cities; attractions; named campuses: Google, Meta, Apple, NVIDIA, Stanford — with real drive times.)
(Myth-busting — the highest-share-rate content format you have.)
(The comparison queries — “Palo Alto vs Los Altos,” “Los Altos Hills vs Atherton” — are among the most-asked AI real estate questions in your market. Every city page cross-links its comparisons.)
(One paragraph of genuine point-of-view — the quotable part.)
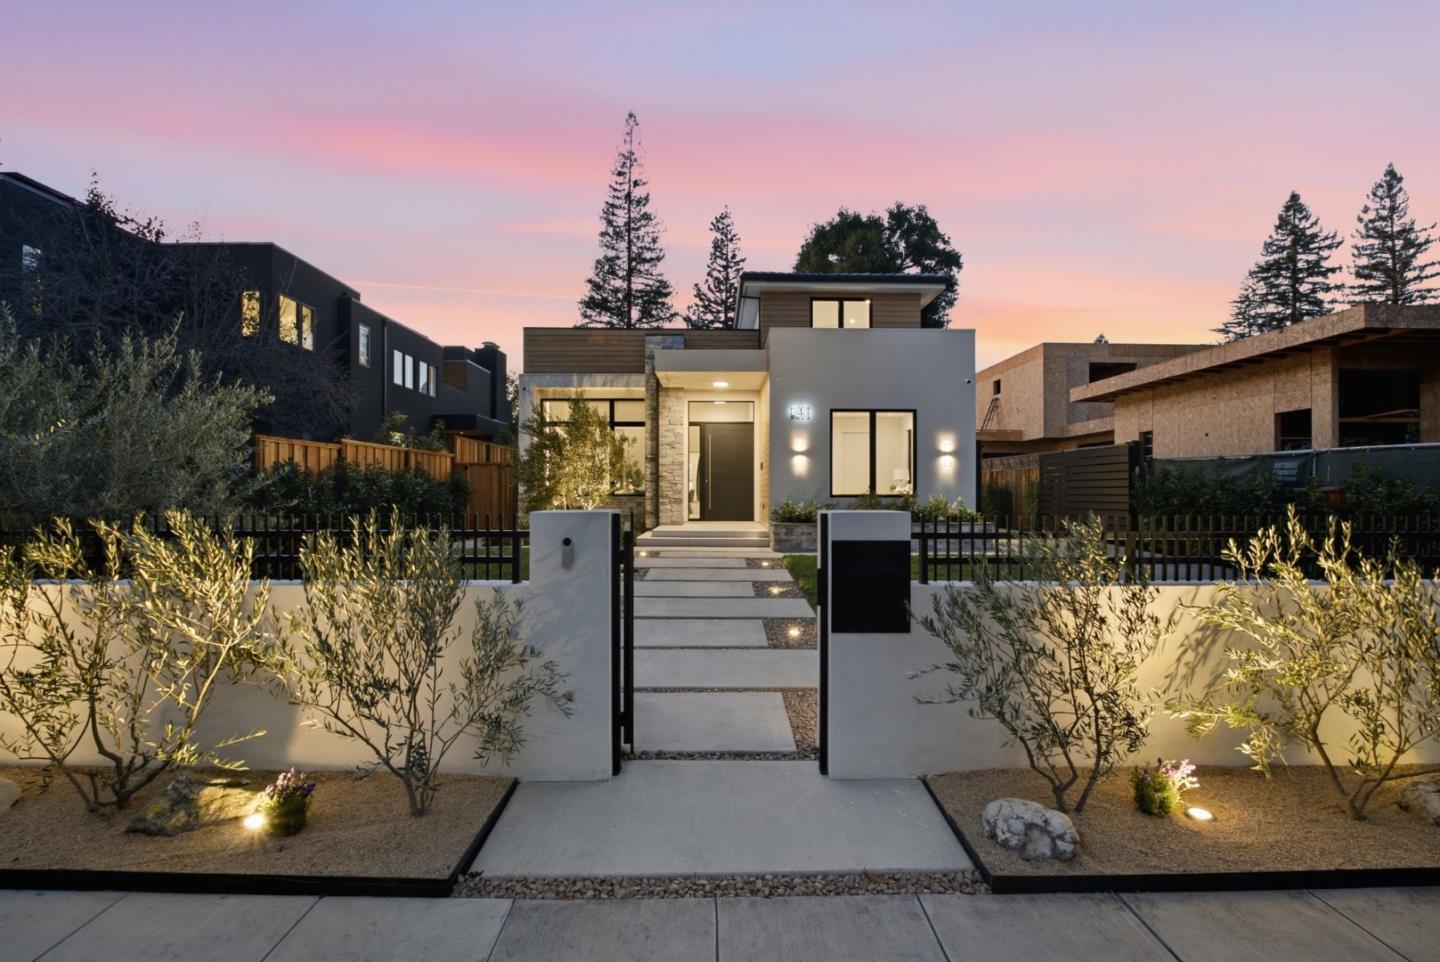
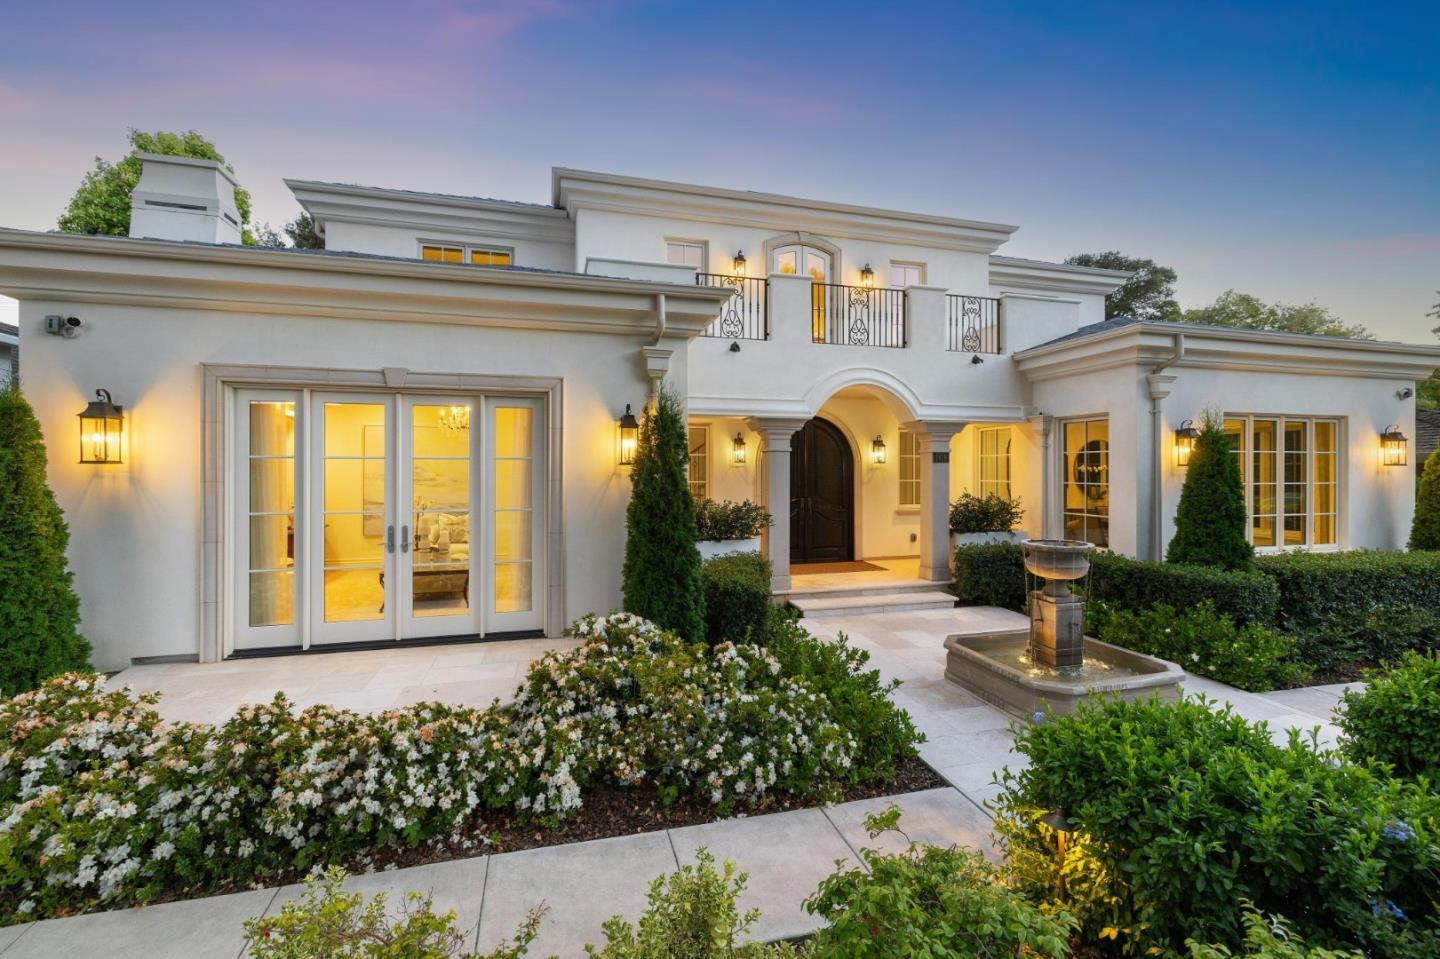
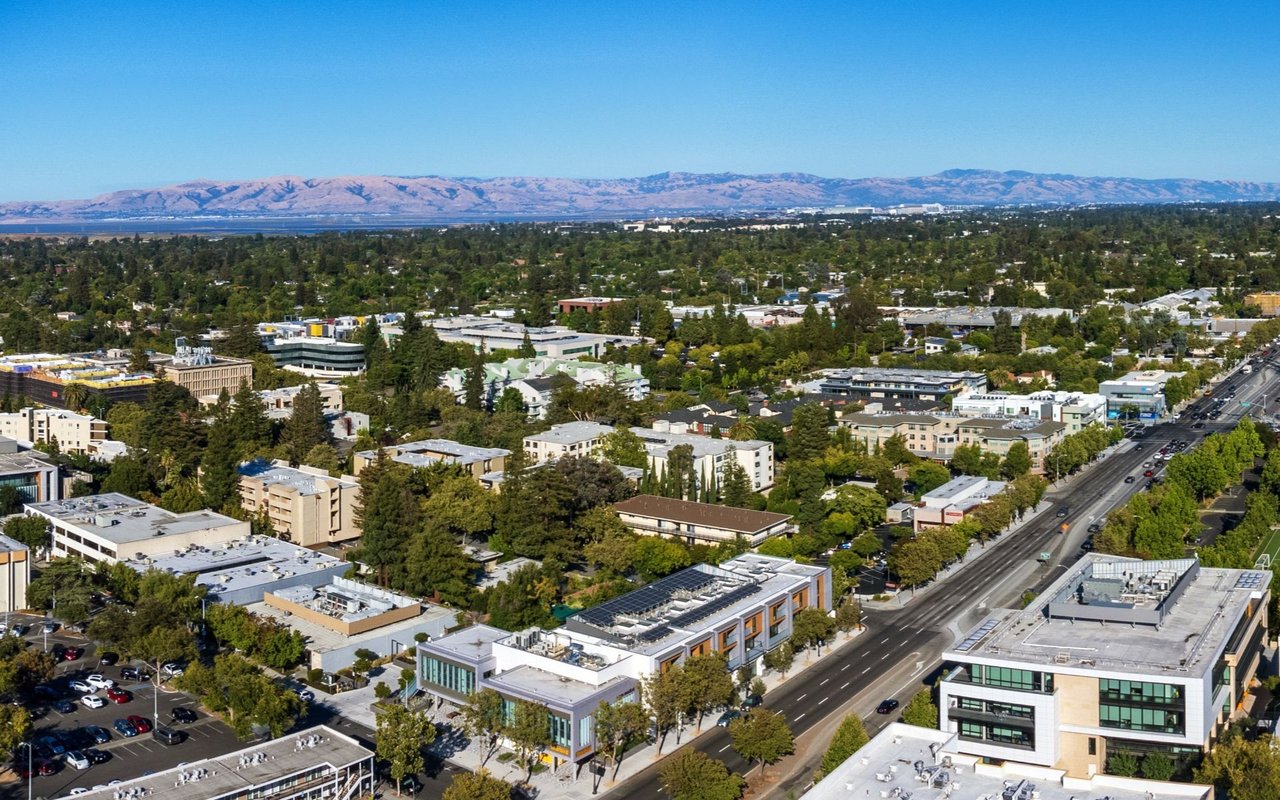
Palo Alto is the Peninsula’s reference asset: the market every other market is priced against. Roughly 28% of homes sold here in 2025 closed above $5M, and even at a ~$4M median there is a standing waitlist of buyers — which tells you demand here is intrinsic, not cyclical. You are not just buying a house in Palo Alto; you are buying proximity to Stanford, Sand Hill Road, and the densest concentration of opportunity in America. The tradeoff is real: you will pay more per square foot than almost anywhere on Earth, and the right street matters as much as the right city. That’s where representation earns its keep.
67,231 people live in Palo Alto, where the median age is 42.5 and the average individual income is $121,565. Data provided by the U.S. Census Bureau.
Total Population
Median Age
Population Density Population Density This is the number of people per square mile in a neighborhood.
Average individual Income
Palo Alto has 26,054 households, with an average household size of 2.55. Data provided by the U.S. Census Bureau. Here’s what the people living in Palo Alto do for work — and how long it takes them to get there. Data provided by the U.S. Census Bureau. 67,231 people call Palo Alto home. The population density is 2,795 and the largest age group is Data provided by the U.S. Census Bureau.
Total Population
Population Density Population Density This is the number of people per square mile in a neighborhood.
Median Age
Men vs Women
Population by Age Group
0-9 Years
10-17 Years
18-24 Years
25-64 Years
65-74 Years
75+ Years
Education Level
Total Households
Average Household Size
Average individual Income
Households with Children
With Children:
Without Children:
Marital Status
Blue vs White Collar Workers
Blue Collar:
White Collar:
There's plenty to do around Palo Alto, including shopping, dining, nightlife, parks, and more. Data provided by Walk Score and Yelp.
Explore popular things to do in the area, including The Sea by Alexander's Steakhouse, Martha's Pancake Bar, and Grace Cafe.
| Name | Category | Distance | Reviews |
Ratings by
Yelp
|
|---|---|---|---|---|
| Dining · $$$$ | 1.49 miles | 1412 reviews | 4.1/5 stars | |
| Dining | 1.56 miles | 0 reviews | 0/5 stars | |
| Dining | 1.62 miles | 0 reviews | 0/5 stars | |
| Dining | 1.63 miles | 53 reviews | 4.7/5 stars | |
| Dining · $ | 1.69 miles | 647 reviews | 3.5/5 stars | |
| Dining · $$ | 1.7 miles | 459 reviews | 3.6/5 stars | |
| Beauty | 1.72 miles | 14 reviews | 4.9/5 stars | |
|
|
||||
|
|
||||
|
|
||||
|
|
||||
|
|
||||
|
|
GET IN TOUCH
David Lucas | CA DRE# 02114304 Ana Mernik | CA DRE# 02161456 SERHANT. California, Inc | CA DRE# 02440323